
Market moves across the month were to the south. Fixed income markets seemed to have a more drastic message on the monitor than that of equities.
Fixed Income: 2-Yr Treas Yield 4.16% | 10-Yr Treas. Yield 4.28%
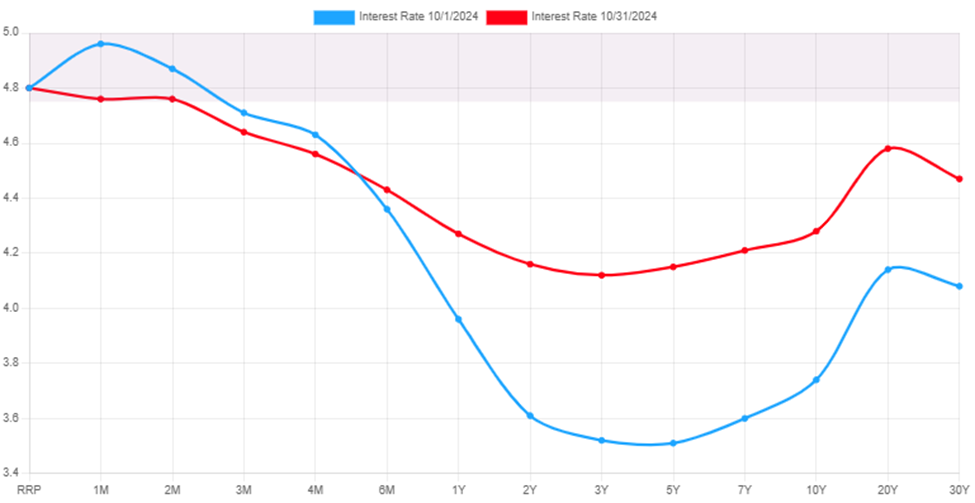
Bond markets went for a reversal ride in October. After several months of falling rates, we began to see a pullback in the bond market as interest rates rose. The 2-year treasury rose 0.55%, while the 10-year treasury rose 0.54%. The good news is that while rising, the rates did not invert again. The long picture remains intact. We are still in an elevated rate environment with them more likely to drift south rather than north. This move may have been the result of predictions for a potential structure that would mean tariffs. This would reflect a higher inflation potential which would signal a slower path in future rate cuts. Additional good news is that while rates from 6 months on rose, shorter duration rates continued to fall. This bodes well for the normalization of the entire curve.
Equities: Dow Jones 1.34% | S&P 500 0.99% | NASDAQ 0.52%
While it was a down month for equites, the overall move south was not bad for the month. From the top of the market for the S&P 500 (10/18/2024) to the end of the month logged a 2.83%. This proved to be a mild lead up to the beginning of November. The nice part is that while a correction has not materialized, earnings season did, bringing the P/E ratio for the S&P 500 back down to 21.19.
Throughout the month utility stock did well until the last week of the month. A shifting towards Financial and consumer discretionary was underway. Neither of which are surprising given interest rates (favoring financials) and the fact that we are in the fourth quarter… I like to say, ‘Americans spend money they do not have on things they do not need’, AKA: holiday season!
Conclusion
Equities pulled back less than was indicative of the rate move on the bond market. The move there signaled more concern about higher rates for longer than equities chose to price in. The shift in rates seemed like a long-term change in projection, while short rates seemed anchored to FRB actions. The longer rage rates often can be equated to long range GDP expectations. If the view is that we would have stronger forward GDP in 5 years, then we see a stronger 5-year rate.
A Look Ahead…
Market responses in October could have been far more drastic than they were. We should feel fortunate that we got the October that we did. This still leaves a correction (a market fall of 10% to 19%) unattended to. The last one ended 10/27/2023. While stretched P/E’s from over the summer have become more reasonable, that’s been due to strong earnings. Those may continue in the short run, but moving into 2025 those might be harder to come by. It may very well cause a correction in the first half of the year.
~ Your Future… Our Services… Together! ~
Your interest in our articles helps us reach more people. To show your appreciation for this post, please “like” the article on one of the links below:
FOR MORE INFORMATION:
If you would like to receive this weekly article and other timely information follow us, here.
Always remember that while this is a week in review, this does not trigger or relate to trading activity on your account with Financial Future Services. Broad diversification across several asset classes with a long-term holding strategy is the best strategy in any market environment.
Any and all third-party posts or responses to this blog do not reflect the views of the firm and have not been reviewed by the firm for completeness or accuracy.
Last week felt like Opposite Day. Will this continue or will data begin to be better represented on the markets?
Monday S&P 500 3.20% | NASDAQ 4.29%
Markets tumbled to open the week. The elevated volatility makes the day’s move far too common. The interesting move on the day was that it was a red day for most sectors. Equities and oil will contradict each other typically, however, they all fell on the day. The 2-year and 10-year yields both fell for the day (Yields and prices move in opposite directions). It what appear to be a safe haven bid for markets.
Tuesday S&P 500 0.25% | NASDAQ 0.98%
The day started firmly in the green as markets attempted to rebound losses from Monday. Those faded as the day wore on, but markets did remain in the green. Also making gains, was treasury prices as yields fell slightly.
Wednesday S&P 500 1.65% | NASDAQ 3.18%
Consumer Price Index (CPI) data came out on Wednesday. It showed that inflation softens slightly year over year, but less than was expected. The resilience of inflation will likely mean the aggressive nature of the Federal Reserve Board (FRB) should continue.
Thursday S&P 500 0.13% | NASDAQ 0.06%
Jobs data showed continued strength in the job market, to no one’s surprise. Additionally, the Producer Price Index (PPI) showed corporate inflationary pressure is persisting. PPI measures input costs for companies and is often a tell on if consumers should expect retail prices to rise. Markets were little changed on the day.
Friday S&P 500 2.39% | NASDAQ 3.82%
Markets rallied broadly on Friday. This was in spite of Consumer Confidence coming in weaker than expected. It is not surprising, as a weaker consumer creates less inflationary pressure. Less inflationary pressure means less cause for the FRB to be more aggressive on rates.
Conclusion S&P 500 2.41% | NASDAQ 2.80%
My kids like to play opposite day quite frequently. Yeah Dad, I cleaned my room… nope… Yeah Dad, I emptied the dish washer… really… Apparently, the stock market is taking a lesson from my kiddos. Good economic data, while good for the economy, signals a more aggressive FRB which will hurt future earnings prospects. Bad economic data, while bad for the economy, signals a more restrained FRB and therefore bodes well for future earnings. Look for opposite day to last the next year or so…
~ Your Future… Our Services… Together! ~
Your interest in our articles helps us reach more people. To show your appreciation for this post, please “like” the article on one of the links below:
FOR MORE INFORMATION:
If you would like to receive this weekly article and other timely information follow us, here.
Always remember that while this is a week in review, this does not trigger or relate to trading activity on your account with Financial Future Services. Broad diversification across several asset classes with a long-term holding strategy is the best strategy in any market environment.
Any and all third-party posts or responses to this blog do not reflect the views of the firm and have not been reviewed by the firm for completeness or accuracy.