

The month looked like it could head south much like December, but ended up green on the monitor. What can we take from that?
Fixed Income: 2-Yr Treas Yield 4.22% | 10-Yr Treas. Yield 4.58%
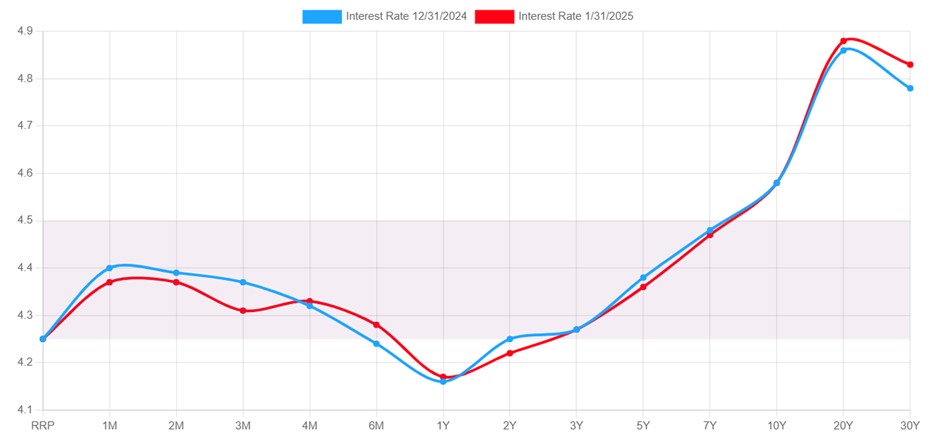
Rates all along the curve were little changed in January. There certainly was movement throughout the month, but nothing meaningful as the 10-year treasury remained fairly range bound. Rates were higher early in the month and slid back to their starting point by the end of the month. Much was made about the potential of tariffs in January. As the month closed, they became a reality for China, but Tariffs against Mexico and Canada are temporarily on hold. The relevance to rates is that Tariffs would cause upward pressure on prices. This prevents the Federal Reserve Board (FRB) from cutting interest rates at an aggressive pace. The first FRB meeting that shows a solid chance of a rate cut is currently projected as June (CME Fedwatch).
Equities: Dow Jones 4.70% | S&P 500 2.70% | NASDAQ 1.64%
The Dow Jones was the big outperformer for the month of January. This was likely the result of their lower concentration in Technology stocks. December saw its wild day come at the hands of the FRB. January saw its wild day as a result of DeepSeek. While we had a handful of more volatile market sessions, the overall VIX index (a measure of market volatility) sits at 15.77. At its highest in January it sat at 19.54. The way to interpret that number is to understand that you take the index reading, divide it by 30 and that is the expected volatility on the daily over the next thirty days. 15.77 would mean we should expect stock market movements of around 0.53% daily… Not very volatile.
Conclusion
For a month when markets seemed to ebb and flow wildly, they really did not. We saw a few volatile days, but otherwise profitable. The month ended in the green for all three major indices courtesy of a strong earnings season thus far.
A Look Ahead…
A market correction was due in the 4th quarter of last year and has yet to materialize. As of January 31st, the S&P 500 carries a Price-to-Earnings (P/E) ratio of 22.43. That reading is approximately 25% rich to its long-term norms. A correction is still due, and valuations warrant it.
~ Your Future… Our Services… Together! ~
Your interest in our articles helps us reach more people. To show your appreciation for this post, please “like” the article on one of the links below:
FOR MORE INFORMATION:
If you would like to receive this weekly article and other timely information follow us, here.
Always remember that while this is a week in review, this does not trigger or relate to trading activity on your account with Financial Future Services. Broad diversification across several asset classes with a long-term holding strategy is the best strategy in any market environment.
Any and all third-party posts or responses to this blog do not reflect the views of the firm and have not been reviewed by the firm for completeness or accuracy.