

Author: Jason Roque, CFP®, APMA®, AWMA®
Title: Investment Adviser Rep – CCO
Tags: S&P 500, NASDAQ, Yield Curve, FRB, Rates, Nvidia
The monitor flashed quite a bit of red last month. But the market was seemingly undeterred and pushed higher anyway. Should this continue?
Fixed Income: 2-Yr Treas Yield 3.91% | 10-Yr Treas. Yield 3.91%
The bond markets saw volatility in August as questions mounted about an impromptu rate-cut by the Federal Reserve Bank (FRB). The most meaningful fall came at the beginning of the month. The perceived weakness in jobs data prompted a move to safety as expectations increased for a rate cut. At the time, people were calling for 0.50% before the September meeting. Cooler heads prevailed and the market is now expecting a 0.25% cut in September. The more impressive data point over the last month was the parody reached on the last trading day of August. This was the first time the two closed at parity since July 5th, 2022! It is still to be determined if rate normalization (higher rates on longer dated fixed income) will prevail. It is a good sign that the anticipated rate cuts are making a large enough impact for us to reach parity.
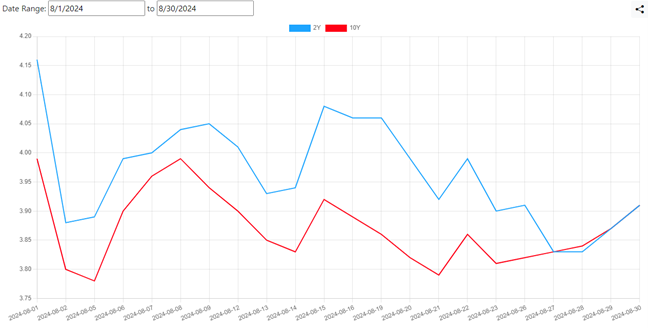
*ustreasuryyieldcurve.com1
Equities: Dow Jones 1.76% | S&P 500 2.28% | NASDAQ 0.65%
The market moves that led to a strong month for fixed income signaled weakness for the equity markets. The Nasdaq lost almost four percent in the first week of the month to spend the next two weeks crawling out of that hole. The last week of the month saw the index continue to falter. Strong earnings from bellwether Nvidia (NVDA) was not enough to bolster confidence. Investors seemed to come to the realization that the FRB will likely take a slow methodical path towards rate reductions. That path did not buoy equity markets. In a retracement of the July trades, other major market categories failed to capitalize on weaker large caps:
S&P 400 (Mid Cap Index): 0.21%
Russell 2000 (Small Cap Index): 1.59%
Conclusion
It was, in all, a good month… That’s for two reasons, 1) fixed income made up ground that equities lost, 2) the spread between the 2-yr treasury and the 10-yr treasury reached parity. Something of a signal that the soft landing the FRB is looking for has been achieved. Generally, a recession (that would be evident by this point) would have caused a normalization of the curve.
A Look Ahead…
We see two key reasons to expect further volatility in equity markets during the next month:
- The 22.40 price to earnings (P/E) ratio for the S&P 500 will need to narrow further before markets can start a real rally.
- September is notoriously the worst month of the year for equities:
- 2023: 5.35%
- 2022: 8.92%
- 2021: 4.89%
- 2020: 4.12%
- 2019: 2.32%
Some logic would point to the high frequency in recent years being a signal that volatility should weaken in September. I find that unlikely given the elevated P/E referenced.
~ Your Future… Our Services… Together! ~
Always remember that while this is a quarter in review, this does not trigger or relate to trading activity on your account with Financial Future Services. Broad diversification across several asset classes with a long-term holding strategy is the best strategy in any market environment.

Any and all third-party posts or responses to this blog do not reflect the views of the firm and have not been reviewed by the firm for completeness or accuracy.