
Markets moved dramatically up last month. Monitoring activity showed a consistent theme.
Fixed Income: 2-Yr Treas Yield 3.60% | 10-Yr Treas. Yield 4.16%
The short end of the curve moved lower in September. This is not surprising as the Federal Reserve Bank (FRB) cut the Fed Funds Rate 0.25% on September 17th. This move was fairly telegraphed at the Jackson Hole Symposium in August. Not only did it deliver the desired effect, the FRB indicated that two additional cuts were likely before year end. An increase in cuts from all other statements leading to that point. While dovish in that regard they came through hawkish for 2026. They indicated not much cutting was expected for the year, estimated at one.
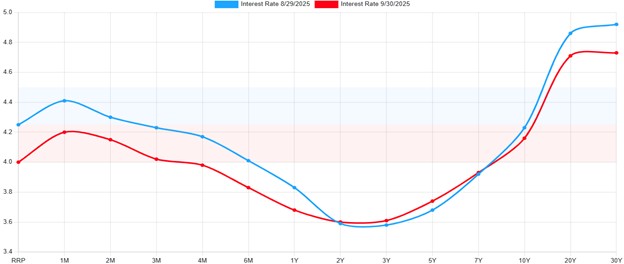
*ustreasuryyieldcurve.com
Equities: Dow Jones 1.87% | S&P 500 3.53% | NASDAQ 5.61%
Equities bucked the common trend of a weak September, as they rose substantially last month. The optimism of FRB rate cuts carried over to the equities for the month. Much of the focus remained in the technology sector and the sphere of influence that surrounds Artificial Intelligence. Meaning that Technology, Communications, and Utilities all showed strength. As evident in the chart below, strength from the rate cut faded about a week later. The weakness likely stemmed from increasing risks of a government shutdown, which we know at this time became a reality.
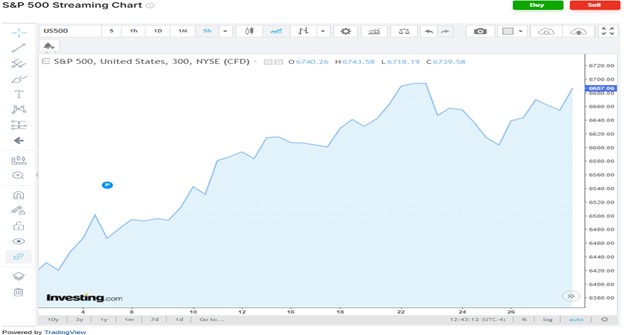
*investing.com/indices/us-spx-500
Conclusion
Equities and most fixed income moved in tandem for September, bringing gains off a common catalyst, an FRB rate cut. That should follow again on 10/29/2025 and 12/10/2025, assuming jobs remain weak, and inflation ticks slowly upward as expected. As mentioned earlier, the shutdown does reduce the amount of information readily available to assess the state of both figures. The longer the shutdown goes the more short-term chaos could develop as paychecks begin to be missed. Truly it is expected to be just that, short-term.
A Look Ahead…
An advancing market is always welcome for investors; however, this recent advance was pretty robust. It also came at a time when we typically see a pullback. To be clear, that does not mean a pullback is due. The S&P 500 price to earnings ratio (P/E) is overpriced at 22.86, but not dramatically. We now move into the 4th quarter where the Santa trade seems to last longer and longer each year. Consumer sentiment should remain sour, but Amazon Prime days, Black Friday, and retail spending to all tell a different story.
~ Your Future… Our Services… Together! ~
Your interest in our articles helps us reach more people. To show your appreciation for this post, please “like” the article on one of the links below:
FOR MORE INFORMATION:
If you would like to receive this weekly article and other timely information follow us, here.
Always remember that while this is a week in review, this does not trigger or relate to trading activity on your account with Financial Future Services. Broad diversification across several asset classes with a long-term holding strategy is the best strategy in any market environment.
Any and all third-party posts or responses to this blog do not reflect the views of the firm and have not been reviewed by the firm for completeness or accuracy.