
It was a wild ride on the monitor last month. How have Markets Shifted?
Fixed Income: 2-Yr Treas Yield 3.38% | 10-Yr Treas. Yield 3.97%
Yields across the curve, starting at 2 years, improved starting on February 11th. Job data started the move towards more favorable rates. It continued due to weaker than expected January Consumer Price Index (CPI) data just a few days later.
Federal Reserve Board (FRB) meeting minutes in January caused some concern as they made reference to possible rate hikes. This concern was short lived as bond yields shed those increases during the next two trading days.
Personal Consumption Expenditures (PCE), out on the 20th, could have put a damper on rate moves, however, it did not. This is the preferred inflation measure of the FRB, but there was one crucial flaw to the data, timing. The data was from December. Instead, Gross Domestic Product (GDP) led the day, coming in at half the expected reading (Q4). This came on slowed output during the government shutdown. Slowing GDP (albeit temporary) and weaker inflationary pressure both signal an increase to rate cut expectations.
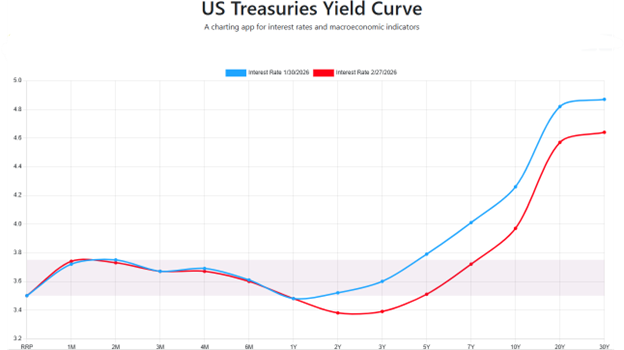
*ustreasuryyieldcurve.com
Equities: Dow Jones 0.17% | S&P 500 0.87% | NASDAQ 3.38%
Headline market indices moved lower in February, but the story is misleading. Underlying US markets were performing while large caps, and specifically growth companies, were not. Here is the 1-month breakdown from Morningstar on 3/2/2026:
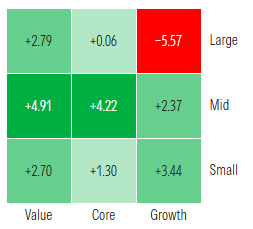
*https://www.morningstar.com/markets
Continued apprehension in Artificial Intelligence was taking a toll on large Software as a Service (SaaS) stocks. The graphic above shows that the general market was benefiting from a redistribution of those assets.
For the S&P500, as a whole, the market traded in a sideways range across the month. It started the month near all-time highs and finished the month almost 2% off those highs.
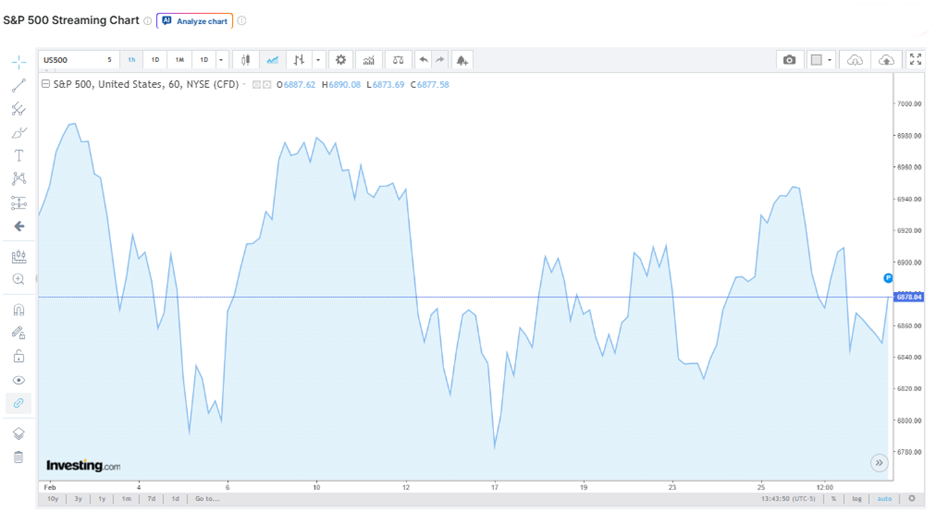
*investing.com/indices/us-spx-500
Conclusion
What is good for the goose is not always good for the gander. Lame… Bond markets picked up steam on the potential of rate cuts (although the cuts will be minimal). At the same time equities sold off on fears surrounding AI risks. CBOE VIX, which is a measure of volatility, ended February at 19.86. During calm periods a reading around 15 is normal. During market corrections, however, it is not uncommon for the reading to move above 30. At 19.86 the reading is still reasonable but warrants caution.
A Look Ahead…
A rise in volatility measures, AI anti-trade, geo-political risks, and softer economic data do warrant caution ahead. There will be stimulus to spending in the next couple months in the form of larger than expected tax refunds. That, however, will be offset by risks mentioned, which likely means a continuation of the redistribution trade from February.
~ Your Future… Our Services… Together! ~
Your interest in our articles helps us reach more people. To show your appreciation for this post, please “like” the article on one of the links below:
FOR MORE INFORMATION:
If you would like to receive this weekly article and other timely information follow us, here.
This communication is for informational purposes only and should not be considered personalized investment advice. Please consult with a licensed financial professional for advice tailored to your individual circumstances. This communication does not contain any testimonials or endorsements.
Any third-party posts or responses may be sponsored or compensated, and do not necessarily reflect the views of the firm. The firm has not reviewed or verified the accuracy of third-party content.